IoT Data Monitoring with DHT22 and ESP8266
🧾 Overview
This post outlines how to build a simple yet effective temperature and humidity monitoring system using a DHT22 sensor and an ESP8266 microcontroller. Sensor data is collected and sent via MQTT, then visualized using Node-RED. 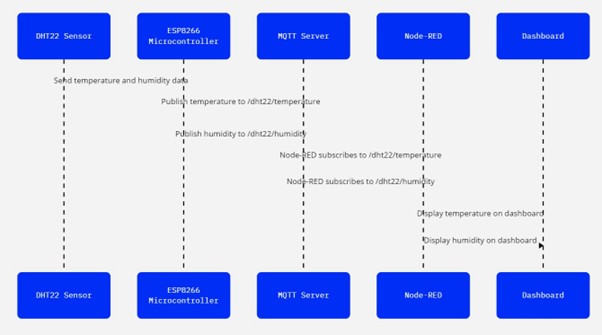
Components Used
- DHT22 Sensor – Digital temperature and humidity sensor.
- ESP8266 Microcontroller – Wi-Fi-enabled microcontroller for IoT projects.
- MQTT Server – Lightweight messaging protocol for connected devices.
- Node-RED – Visual tool for wiring together hardware and services.
🔌 Hardware Setup
Connecting the DHT22 to ESP8266
- VCC → 3.3V on ESP8266
- GND → GND on ESP8266
- DATA → GPIO pin (e.g., D5)
Tip: A 10kΩ resistor between VCC and DATA can improve stability.
💻 Software Configuration
1. Programming the ESP8266
- Use Arduino IDE.
- Install libraries:
DHT.h,PubSubClient.h. - Connect the ESP8266 to Wi-Fi.
- Read temperature and humidity in the
loop()function.
1
2
3
4
5
6
7
8
9
10
11
12
13
14
15
16
17
18
19
20
21
22
23
24
25
26
27
28
29
30
31
32
33
34
35
36
37
38
39
40
41
42
43
44
45
46
47
48
49
50
51
52
53
54
55
56
57
58
59
60
61
62
63
64
65
66
67
68
69
70
71
72
73
74
75
76
77
78
79
80
81
82
83
84
85
86
87
88
89
90
91
92
93
94
95
96
97
98
99
100
101
102
103
104
105
106
107
108
109
110
111
112
113
114
115
116
117
118
119
120
121
122
123
124
125
126
127
128
129
130
131
132
133
134
135
136
137
138
139
140
141
#include <ESP8266WiFi.h>
#include <ESP8266mDNS.h>
#include <WiFiUdp.h>
#include <ArduinoOTA.h>
#include <DHT.h>
#include <AsyncMqttClient.h>

#ifndef STASSID
#define STASSID "Croft"
#define STAPSK "wifipassword"
#endif

// Global Variables
WiFiUDP UDP;
WakeOnLan WOL(UDP);
AsyncMqttClient mqttClient;
const char* ssid = STASSID;
const char* password = STAPSK;
const char* mqttServer = "192.168.0.111";
const int mqttPort = 1883;
const char* mqttUser = "admin";
const char* mqttPassword = "securepassword";
const char* mqttTopicTemperature = "sensor/dht22/temperature";
const char* mqttTopicHumidity = "sensor/dht22/humidity";
const char* mqttTopiclogs = "sensor/dht22/logs";

#define DHTPIN D6
#define DHTTYPE DHT22
DHT dht(DHTPIN, DHTTYPE);
unsigned long previousMillis = 0;
const long interval = 10000;  // 10 seconds
bool mqttConnected = false;

unsigned long lastReconnectAttempt = 0;
const unsigned long reconnectInterval = 5000; // 5 seconds

// Function Declarations
void setupWiFi();
void setupMQTT();
void publishSensorData();
void connectToMqtt();

void setup() {
  Serial.begin(115200);
  Serial.println("Booting");
  pinMode(D5, INPUT_PULLUP);
  dht.begin();

  setupWiFi();

  Serial.println("Ready");
  Serial.print("IP address: ");
  Serial.println(WiFi.localIP());
}

void loop() {
  unsigned long currentMillis = millis();
  if (currentMillis - previousMillis >= interval) {
    previousMillis = currentMillis;
    if (WiFi.isConnected() && mqttConnected) {
      publishSensorData();
    }
  }

  // Handle MQTT reconnection logic
  if (!mqttConnected && WiFi.isConnected()) {
    unsigned long now = millis();
    if (now - lastReconnectAttempt >= reconnectInterval) {
      lastReconnectAttempt = now;
      connectToMqtt();  // Attempt to reconnect
    }
  }
}

void setupWiFi() {
  WiFi.mode(WIFI_STA);
  WiFi.setSleepMode(WIFI_NONE_SLEEP);
  WiFi.begin(ssid, password);

  Serial.print("Connecting to WiFi ..");
    while (WiFi.status() != WL_CONNECTED) {
    Serial.print('.');
    delay(1000);
  }
  WiFi.setAutoReconnect(true);
  WiFi.persistent(true);

  setupMQTT();
}

void setupMQTT() {
    mqttClient.onConnect([](bool sessionPresent) {
        Serial.println("Connected to MQTT broker.");
        mqttConnected = true;
        mqttClient.publish(mqttTopiclogs, 0, false, "Device Connected");
    });

    mqttClient.onDisconnect([](AsyncMqttClientDisconnectReason reason) {
        Serial.println("Disconnected from MQTT broker.");
        mqttConnected = false;
        if (WiFi.isConnected()) {
            connectToMqtt();
        }
    });

    mqttClient.setServer(mqttServer, mqttPort);
    mqttClient.setCredentials(mqttUser, mqttPassword);
    mqttClient.setKeepAlive(60); // Set keep-alive interval to 60 seconds
    mqttClient.setCleanSession(true);

    connectToMqtt();
}

void connectToMqtt() {
    if (!mqttConnected) {
        Serial.println("Connecting to MQTT broker...");
        mqttClient.connect();
    }
}

void publishSensorData() {
  float temperature = dht.readTemperature();
  float humidity = dht.readHumidity();

  if (isnan(temperature) || isnan(humidity)) {
    Serial.println("Failed to read from DHT sensor!");
    return;
  }

  String temperaturePayload = String(temperature);
  String humidityPayload = String(humidity);

  Serial.print("Publishing temperature: ");
  Serial.println(temperaturePayload);
  mqttClient.publish(mqttTopicTemperature, 0, false, temperaturePayload.c_str());

  Serial.print("Publishing humidity: ");
  Serial.println(humidityPayload);
  mqttClient.publish(mqttTopicHumidity, 0, false, humidityPayload.c_str());
}
2. Publishing Data to MQTT
The ESP8266 connects to an MQTT broker and publishes sensor readings as follows:
- Temperature is sent to the topic
/dht22/temperature - Humidity is sent to the topic
/dht22/humidity
It uses QoS level 0, meaning each message is delivered at most once, with no guarantee of delivery.
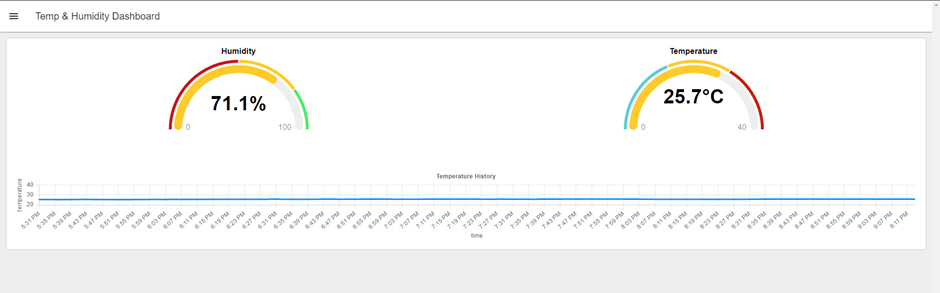
📊 Data Visualization
Setting Up Node-RED
Node-RED is installed on a local server or cloud-hosted environment. MQTT input nodes are configured to subscribe to the following topics:
/dht22/temperature/dht22/humidity
These values are then piped into UI elements using Node-RED Dashboard nodes to display the sensor data in real time.
Dashboard Configuration
A clean, user-friendly interface is created to visualize:
- Temperature and humidity using gauges and charts
- Optional alerts/notifications triggered when values exceed defined thresholds
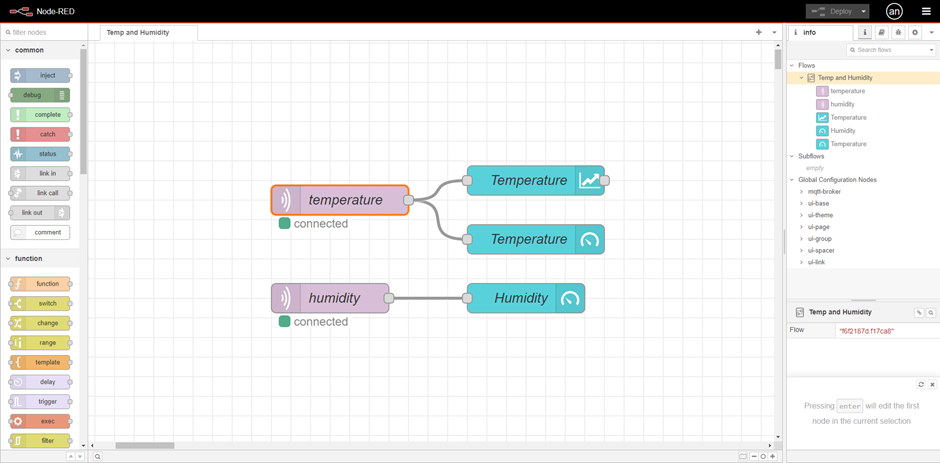
🧩 Node-RED Flow Code
1
2
3
4
5
6
7
8
9
10
11
12
13
14
15
16
17
18
19
20
21
22
23
24
25
26
27
28
29
30
31
32
33
34
35
36
37
38
39
40
41
42
43
44
45
46
47
48
49
50
51
52
53
54
55
56
57
58
59
60
61
62
63
64
65
66
67
68
69
70
71
72
73
74
75
76
77
78
79
80
81
82
83
84
85
86
87
88
89
90
91
92
93
94
95
96
97
98
99
100
101
102
103
104
105
106
107
108
109
110
111
112
113
114
115
116
117
118
119
120
121
122
123
124
125
126
127
128
129
130
131
132
133
134
135
136
137
138
139
140
141
142
143
144
145
146
147
148
149
150
151
152
153
154
155
156
157
158
159
160
161
162
163
164
165
166
167
168
169
170
171
172
173
174
175
176
177
178
179
180
181
182
183
184
185
186
187
188
189
190
191
192
193
194
195
196
197
198
199
200
201
202
203
204
205
206
207
208
209
210
211
212
213
214
215
216
217
218
219
220
221
222
223
224
225
226
227
228
229
230
231
232
233
234
235
236
237
238
239
240
241
242
243
244
245
246
247
248
249
250
251
252
253
254
255
256
257
258
259
260
261
262
263
264
265
266
267
268
269
270
271
272
273
274
275
276
277
278
279
280
281
282
283
284
285
286
287
288
289
290
291
292
293
294
295
296
297
298
299
300
301
302
303
304
305
306
307
308
309
310
311
312
313
314
315
316
317
318
319
320
321
322
323
324
325
326
327
328
329
330
331
332
333
334
335
336
337
338
339
340
341
342
343
344
345
346
347
348
349
350
351
352
353
354
355
356
357
358
359
360
361
362
363
364
365
366
367
368
369
370
371
372
373
374
375
376
377
378
379
380
381
382
383
384
385
386
387
388
389
390
391
392
393
394
395
396
397
398
399
400
401
402
403
404
405
406
407
408
409
410
411
412
413
414
415
416
417
418
419
420
421
422
423
424
425
426
427
428
429
430
431
432
433
434
435
436
437
438
439
440
441
442
443
444
445
446
447
448
449
450
451
[
    {
        "id": "9091f69b37f10b67",
        "type": "tab",
        "label": "Temp and Humidity",
        "disabled": false,
        "info": ""
    },
    {
        "id": "4a8b8f54d10f3ac6",
        "type": "mqtt in",
        "z": "9091f69b37f10b67",
        "name": "temperature",
        "topic": "sensor/dht22/temperature",
        "qos": "1",
        "datatype": "auto-detect",
        "broker": "8d58475734db1eba",
        "nl": false,
        "rap": true,
        "rh": 0,
        "inputs": 0,
        "x": 490,
        "y": 180,
        "wires": [
            [
                "4b5847376904ff49",
                "b393830186babd75",
                "ed83598265cda1e3",
                "cf3becef847417f5"
            ]
        ]
    },
    {
        "id": "c0fe92e5eea40661",
        "type": "mqtt in",
        "z": "9091f69b37f10b67",
        "name": "humidity",
        "topic": "sensor/dht22/humidity",
        "qos": "1",
        "datatype": "auto-detect",
        "broker": "8d58475734db1eba",
        "nl": false,
        "rap": true,
        "rh": 0,
        "inputs": 0,
        "x": 480,
        "y": 320,
        "wires": [
            [
                "b393830186babd75",
                "ed83598265cda1e3",
                "0d4616ec603d3bc4",
                "4cdb0a67ce79c6d3"
            ]
        ]
    },
    {
        "id": "4b5847376904ff49",
        "type": "ui-chart",
        "z": "9091f69b37f10b67",
        "group": "3aa8726e5da53852",
        "name": "Temperature",
        "label": "Temperature History",
        "order": 6,
        "chartType": "line",
        "category": "topic",
        "categoryType": "msg",
        "xAxisLabel": "time",
        "xAxisProperty": "",
        "xAxisPropertyType": "timestamp",
        "xAxisType": "time",
        "xAxisFormat": "",
        "xAxisFormatType": "auto",
        "xmin": "0",
        "xmax": "40",
        "yAxisLabel": "temperature",
        "yAxisProperty": "payload",
        "yAxisPropertyType": "msg",
        "ymin": "",
        "ymax": "40",
        "bins": 10,
        "action": "append",
        "stackSeries": false,
        "pointShape": "false",
        "pointRadius": 4,
        "showLegend": false,
        "removeOlder": "24",
        "removeOlderUnit": "3600",
        "removeOlderPoints": "",
        "colors": [
            "#0095ff",
            "#ff0000",
            "#ff7f0e",
            "#2ca02c",
            "#a347e1",
            "#d62728",
            "#ff9896",
            "#9467bd",
            "#c5b0d5"
        ],
        "textColor": [
            "#666666"
        ],
        "textColorDefault": true,
        "gridColor": [
            "#e5e5e5"
        ],
        "gridColorDefault": true,
        "width": null,
        "height": null,
        "className": "",
        "interpolation": "linear",
        "x": 690,
        "y": 160,
        "wires": [
            []
        ]
    },
    {
        "id": "b393830186babd75",
        "type": "debug",
        "z": "9091f69b37f10b67",
        "name": "debug 1",
        "active": false,
        "tosidebar": true,
        "console": false,
        "tostatus": false,
        "complete": "payload",
        "targetType": "msg",
        "statusVal": "",
        "statusType": "auto",
        "x": 660,
        "y": 40,
        "wires": []
    },
    {
        "id": "ed83598265cda1e3",
        "type": "trigger",
        "z": "9091f69b37f10b67",
        "name": "",
        "op1": "Connected",
        "op2": "Not Connected",
        "op1type": "str",
        "op2type": "str",
        "duration": "15",
        "extend": true,
        "overrideDelay": false,
        "units": "s",
        "reset": "",
        "bytopic": "all",
        "topic": "topic",
        "outputs": 1,
        "x": 690,
        "y": 400,
        "wires": [
            [
                "a12c062203354683"
            ]
        ]
    },
    {
        "id": "a12c062203354683",
        "type": "ui-text",
        "z": "9091f69b37f10b67",
        "group": "3aa8726e5da53852",
        "order": 1,
        "width": 0,
        "height": 0,
        "name": "Status",
        "label": "System Status: ",
        "format": "",
        "layout": "row-left",
        "style": false,
        "font": "",
        "fontSize": 16,
        "color": "#717171",
        "wrapText": false,
        "className": "",
        "x": 870,
        "y": 400,
        "wires": []
    },
    {
        "id": "0d4616ec603d3bc4",
        "type": "ui-chart",
        "z": "9091f69b37f10b67",
        "group": "3aa8726e5da53852",
        "name": "Humidity",
        "label": "Humidity History",
        "order": 4,
        "chartType": "line",
        "category": "topic",
        "categoryType": "msg",
        "xAxisLabel": "time",
        "xAxisProperty": "",
        "xAxisPropertyType": "timestamp",
        "xAxisType": "time",
        "xAxisFormat": "",
        "xAxisFormatType": "auto",
        "xmin": "0",
        "xmax": "40",
        "yAxisLabel": "humidity",
        "yAxisProperty": "payload",
        "yAxisPropertyType": "msg",
        "ymin": "40",
        "ymax": "100",
        "bins": 10,
        "action": "append",
        "stackSeries": false,
        "pointShape": "false",
        "pointRadius": 4,
        "showLegend": false,
        "removeOlder": "24",
        "removeOlderUnit": "3600",
        "removeOlderPoints": "",
        "colors": [
            "#0095ff",
            "#ff0000",
            "#ff7f0e",
            "#2ca02c",
            "#a347e1",
            "#d62728",
            "#ff9896",
            "#9467bd",
            "#c5b0d5"
        ],
        "textColor": [
            "#666666"
        ],
        "textColorDefault": true,
        "gridColor": [
            "#e5e5e5"
        ],
        "gridColorDefault": true,
        "width": "",
        "height": "",
        "className": "",
        "interpolation": "bezier",
        "x": 680,
        "y": 340,
        "wires": [
            []
        ]
    },
    {
        "id": "cf3becef847417f5",
        "type": "ui-gauge",
        "z": "9091f69b37f10b67",
        "name": "Temperature",
        "group": "3aa8726e5da53852",
        "order": 2,
        "width": 6,
        "height": "",
        "gtype": "gauge-half",
        "gstyle": "rounded",
        "title": "Temperature",
        "units": "",
        "icon": "temperature",
        "prefix": "",
        "suffix": "°C",
        "segments": [
            {
                "from": "0",
                "color": "#add8e6"
            },
            {
                "from": "20",
                "color": "#90ee90"
            },
            {
                "from": "30",
                "color": "#ffa500"
            },
            {
                "from": "40",
                "color": "#ff6347"
            }
        ],
        "min": 0,
        "max": "50",
        "sizeThickness": 16,
        "sizeGap": 4,
        "sizeKeyThickness": 8,
        "styleRounded": true,
        "styleGlow": false,
        "className": "",
        "x": 990,
        "y": 220,
        "wires": []
    },
    {
        "id": "4cdb0a67ce79c6d3",
        "type": "ui-gauge",
        "z": "9091f69b37f10b67",
        "name": "Humidity",
        "group": "3aa8726e5da53852",
        "order": 3,
        "width": 6,
        "height": "",
        "gtype": "gauge-half",
        "gstyle": "rounded",
        "title": "Humidity",
        "units": "",
        "icon": "",
        "prefix": "",
        "suffix": "%",
        "segments": [
            {
                "from": "0",
                "color": "#add8e6"
            },
            {
                "from": "30",
                "color": "#90ee90"
            },
            {
                "from": "60",
                "color": "#ff6347"
            }
        ],
        "min": 0,
        "max": "100",
        "sizeThickness": 16,
        "sizeGap": 4,
        "sizeKeyThickness": 8,
        "styleRounded": true,
        "styleGlow": false,
        "className": "",
        "x": 980,
        "y": 280,
        "wires": []
    },
    {
        "id": "8d58475734db1eba",
        "type": "mqtt-broker",
        "name": "conn_mqtt_emqx",
        "broker": "192.168.1.191",
        "port": 1883,
        "clientid": "",
        "autoConnect": true,
        "usetls": false,
        "protocolVersion": "5",
        "keepalive": 60,
        "cleansession": true,
        "autoUnsubscribe": true,
        "birthTopic": "",
        "birthQos": "0",
        "birthRetain": "false",
        "birthPayload": "",
        "birthMsg": {},
        "closeTopic": "",
        "closeQos": "0",
        "closeRetain": "false",
        "closePayload": "",
        "closeMsg": {},
        "willTopic": "",
        "willQos": "0",
        "willRetain": "false",
        "willPayload": "",
        "willMsg": {},
        "userProps": "",
        "sessionExpiry": ""
    },
    {
        "id": "3aa8726e5da53852",
        "type": "ui-group",
        "name": "DHT",
        "page": "c8a231487564b8d4",
        "width": "12",
        "height": 1,
        "order": 1,
        "showTitle": false,
        "className": "",
        "visible": "true",
        "disabled": "false",
        "groupType": "default"
    },
    {
        "id": "c8a231487564b8d4",
        "type": "ui-page",
        "name": "Temp & Humidity Dashboard",
        "ui": "1a05bc597330128a",
        "path": "/",
        "icon": "home",
        "layout": "grid",
        "theme": "ae7c97d9fbfbcb1c",
        "breakpoints": [
            {
                "name": "Default",
                "px": "0",
                "cols": "3"
            },
            {
                "name": "Tablet",
                "px": "576",
                "cols": "6"
            },
            {
                "name": "Small Desktop",
                "px": "768",
                "cols": "9"
            },
            {
                "name": "Desktop",
                "px": "1024",
                "cols": "12"
            }
        ],
        "order": 1,
        "className": "",
        "visible": true,
        "disabled": false
    },
    {
        "id": "1a05bc597330128a",
        "type": "ui-base",
        "name": "My Dashboard",
        "path": "/dashboard",
        "appIcon": "",
        "includeClientData": true,
        "acceptsClientConfig": [
            "ui-notification",
            "ui-control"
        ],
        "showPathInSidebar": false,
        "navigationStyle": "default",
        "titleBarStyle": "default",
        "showReconnectNotification": true,
        "notificationDisplayTime": 1,
        "showDisconnectNotification": true
    },
    {
        "id": "ae7c97d9fbfbcb1c",
        "type": "ui-theme",
        "name": "Default Theme",
        "colors": {
            "surface": "#ffffff",
            "primary": "#cc8319",
            "bgPage": "#eeeeee",
            "groupBg": "#ffffff",
            "groupOutline": "#cccccc"
        },
        "sizes": {
            "density": "default",
            "pagePadding": "12px",
            "groupGap": "12px",
            "groupBorderRadius": "4px",
            "widgetGap": "12px"
        }
    }
]
🛠️ Improvements and Optimizations
1. Data Collection & Transmission
- Reduce data transmission frequency to conserve bandwidth and power.
- Implement data smoothing techniques to minimize sensor noise.
2. Reliability & Robustness
- Add error handling for sensor read failures and Wi-Fi disconnections.
- Use a watchdog timer to automatically reset the ESP8266 if unresponsive.
3. Security
- Secure MQTT communication using SSL/TLS.
- Add authentication to the MQTT broker to prevent unauthorized access.
4. Advanced Data Visualization
- Store historical data using a time-series database like InfluxDB.
- Integrate Grafana with Node-RED for rich, customizable dashboards.
- Enable mobile notifications for critical events and threshold breaches.
👉 Check out the real-time dashboard here
5. Code Optimization
- Use deep sleep mode and efficient loops to reduce power consumption.
- Structure code into reusable modules for better maintainability.
✅ Conclusion
By following this setup, you can build a robust and efficient system for monitoring environmental conditions using a DHT22 sensor and ESP8266 microcontroller. Leveraging MQTT for lightweight communication and Node-RED for intuitive visualization makes this project a practical and scalable solution for IoT applications.